
Results of HA Basic Survey, Part One: Demographic Considerations
Disclaimer About Survey Results
The Homeschoolers Anonymous (HA) Basic Survey was conducted for adult graduates of the Christian homeschool movement. Throughout this survey, “respondents” will signify the 242 individuals from 42 U.S. states and 8 foreign countries that participated in the survey.
These respondents do not necessarily reflect all adult homeschool graduates, nor is it claimed that these 242 individuals are a representative sample. Three important considerations are to be considered:
- This survey was conducted for graduates of the Christian homeschool movement specifically.
- This survey was open for anyone who desired to participate, thus it is self-selected.
- Effort was made to solicit diverse responses from this specific subculture of adult homeschool graduates, whether their experiences were positive or negative. At the same time, the primary methods for promoting the survey came from the social media channels and blog partners of HA.
The survey was designed by HA with the explicit purpose of helping to identify experiential and qualitative patterns as well as learning what the HA community’s needs are.
Geographical Considerations
242 adult graduates of the Christian homeschool movement took the HA Basic Survey.
Those 242 individuals represented 42 U.S. states and 8 foreign countries.
U.S. states represented in this survey include: Alabama, Arizona, Arkansas, California, Colorado, Connecticut, Florida, Georgia, Hawaii, Idaho, Illinois, Indiana, Kansas, Kentucky, Louisiana, Maryland, Massachusetts, Michigan, Minnesota, Mississippi, Missouri, Montana, Nebraska, Nevada, New Jersey, New Mexico, New York, North Carolina, North Dakota, Ohio, Oklahoma, Oregon, Pennsylvania, South Carolina, Tennessee, Texas, Utah, Vermont, Virginia, Washington, West Virginia, and Wisconsin.
The average response per state was 5.45 survey responses.
States with one survey respondent only included: Connecticut, Minnesota, Montana, Nevada, North Dakota, South Carolina, Utah, Vermont, and West Virginia.
States with high numbers of survey respondents included: Florida (13 survey respondents), Georgia (13), Oregon (13), Texas (21), Virginia (10), and Washington (14).
California had the highest number of survey respondents for a U.S. state with 42.
Foreign countries represented in this survey included: Canada, Australia, Philippines, Eastern Europe, South Korea, Mexico, England, and Iceland. Canada had the highest number of survey respondents for a foreign country with 4.
HSLDA Considerations
The majority of respondents are from families which were members of the Home School Legal Defense Association (HSLDA).
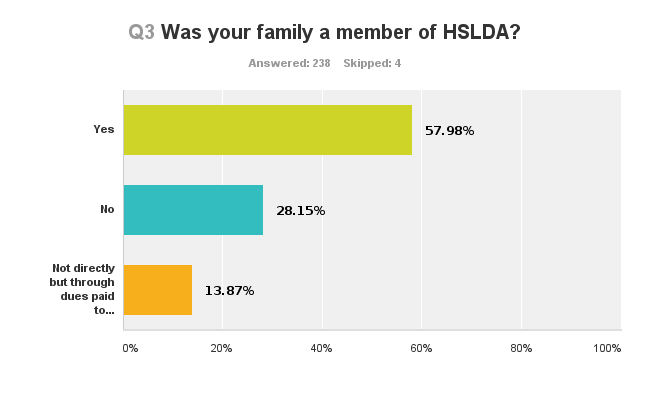
57.98% (138) of the graduates’ families were directly members of HSLDA.
13.87% (33) of the graduates’ families were indirectly members of HSLDA, through dues paid to a local or state homeschool organization.
28.15% (67) of the graduates’ families were not members of HSLDA.
Economic Considerations
The majority of respondents are from middle class families.

70.95% (171) of the graduates’ families were in the middle class (with incomes between $32,500 and $100,000 a year).
17.43% (42) of the graduates’ families were in the lower class or below the poverty line (with incomes lower than $32,500 a year).
11.62% (28) of the graduates’ families were in the upper class (with incomes above $100,000 a year).
Educational Considerations
235 individuals stated the length of their homeschool experience, with a cumulative total of 2641 years. Thus the average length of each individual’s homeschool experience was 11 years.
This means that this survey represents individuals whose primary educational experience from K-12 was almost entirely through homeschooling.

The primary teachers of the overwhelming majority of respondents were their mothers. Mothers were the primary teachers of 80.91% (195) of the graduates.
The second most common primary teacher of the graduates (at 13.28%, or 32) was “other” than mother, father, other relative, co-op teacher, or tutor. When asked to specify, the majority of these graduates specified “myself’ or “no one,” with personalized answers such as:
- “From first grade on, I did everything by myself but my parents would help sometimes if I got stuck.”
- “I attended classes once a week, but ‘taught myself’ at home otherwise.”
- “Basics were taught by oldest sister. 6-9 (I took from 13-18 to get through these grades) were done on my own…”
- “Myself. I also was responsible for teaching my brothers.”
- “No one. We read our text books alone.”
- “No real effort was made in my homeschooling. I was run around to activities but other than that largely self taught and given the answer keys to check my own answers after I completed the booklet.”
3.73% (9) of respondents said their primary teacher was both their mother and their father evenly.
1.24% (3) of respondents said their primary teacher was a non-family member such as a teacher at a co-op or a tutor.
0.83% (2) of respondents said their primary teacher was their father.
The highest level of education of the primary teacher of each respondent is most commonly an associates or undergraduate degree.
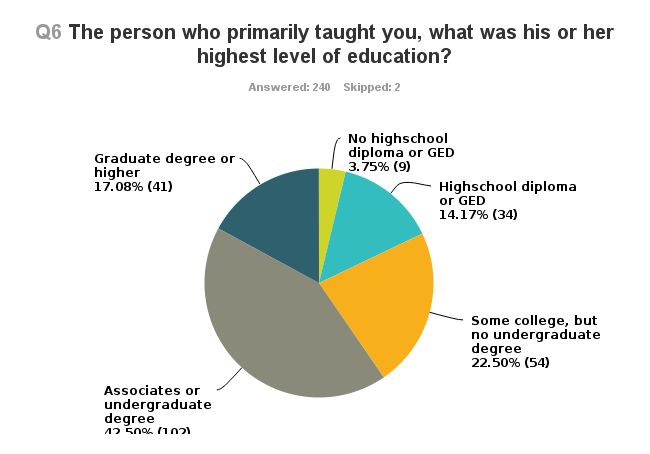
42.50% (102) of the primary teachers had associates or undergraduate degrees. 22.50% (54) had some college education but no degree. 14.17% (34) had a high school diploma or GED. 3.75% (9) had neither a high school diploma nor GED. 17.08% (41) had a graduate degree or higher.
This means 59.58% of the primary teachers had an associates degree or higher.
The highest level of completed education for the plurality of respondents is an associates or undergraduate degree.
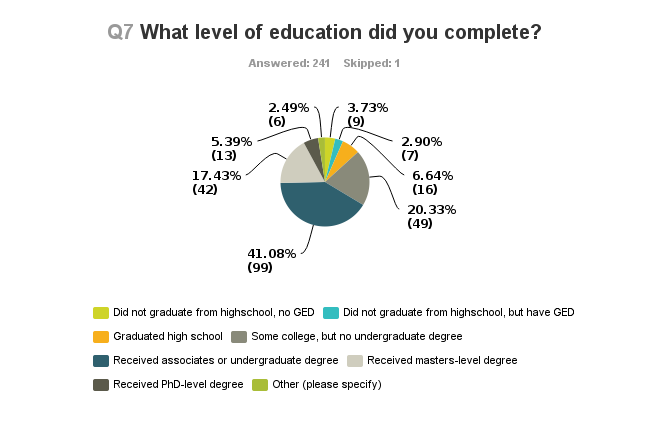
The highest level of completed education for 41.08% (99) of adult homeschool graduates is an associates or undergraduate degree; for 17.43% (42), a masters-level degree; for 5.39% (13), a PhD-level degree; for 20.33% (49), some college education, but no college degree; for 6.64% (16), a high school diploma; for 2.90% (7), GED but no high school diploma; and for 3.73% (9), no GED and no high school diploma.
This means 63.9% of respondents have an associates degree or higher. This is an improvement of exactly 4.32% over the percentage of the graduates’ primary teachers with associates degrees or higher.
Religious Considerations
The majority of respondents said their homeschool experience was fundamentalist Christian.
190 individuals, or 78.84%, said their homeschool experience was fundamentalist Christian.
33 individuals, or 13.68%, said their homeschool experience was non-fundamentalist Christian.
18 individuals, or 7.47%, declined to provide information relevant to this question.
*****
< 2013 HA Basic Survey: Main Page | Part Two: Summary of Findings >

Interesting how little people said father. We have a long ways to go in feminism.
LikeLike
How many of the 20.33% of the survey takers that have “some college, no undergraduate degree” are currently taking college courses and have therefore may not completed the degree but are in the process?
LikeLike