Results of HA Basic Survey, Part Three: Economics as a Factor in Educational Quality, Abuse, and Current Religious Beliefs
Economics and Educational Quality
Averaging the scores for all aspects, respondents gave their educational experience a score of 3.06, barely above the median score category of “So-so.”
For the lower class, the average score was 2.71, below “So-so.”
For the middle class, the average score was 3.10, above “So-so” and slightly above the average for all class scores.
For the upper class, the average score was 3.37, well above “So-so.”
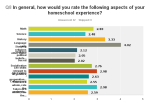
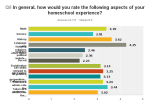
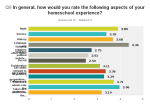
Certain aspects of homeschool experiences were significantly different between economic classes. For example, Math was ranked by those in the lower class at 2.83; this significantly increased in the middle class to 3.39, and to 3.89 in the upper class. Similarly, Science was ranked by those in the lower class at 2.48; this significantly increased in the middle class to 2.81, and to 3.39 in the upper class.
Certain aspects of homeschool experiences did not change much regardless of economics. Sex education, for example, stayed within a narrow range between “Inadequate” and “So-so.” The lower class ranked it at 2.02, the middle class at 2.23, and the upper class at 2.5. The same occurred with political diversity: lower class ranked it at 2.05, middle class at 2.36, and upper class at 2.61.
In general, every single aspect of respondents’ experiences seemed to improved as wealth increased.
The only exception to this, interestingly, is socialization.
The lower class ranked socialization at 2.76; this increased to 3.14 in the middle class. But then it decreased to 3.11 in the upper class.
The most telling way in which economics related to educational quality is in the scores for the category Academic Experiences (As A Whole). The lower class rated their homeschool experiences in totality at 2.98, the middle class at 3.44, and the upper class at 3.96. That is an increase in nearly an entire point between the lower class and the upper class, raising the quality of the academic experience from “So-So” to “Adequate.”
Economics and Abuse
In contrast to educational quality, abuse did not seem to necessarily correlate to a decrease or increase in wealth for respondents.
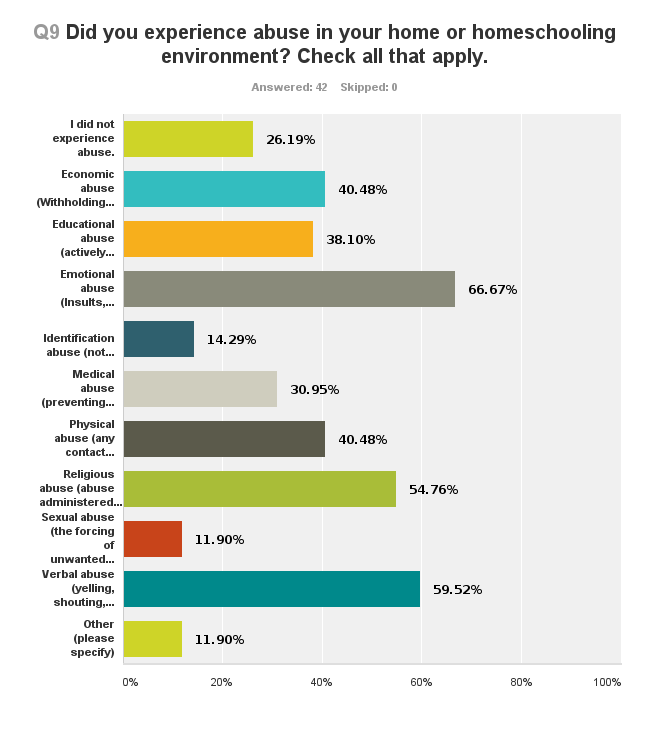
The average for all economic classes for those that experienced abuse in their home or homeschooling environment was 60.92%.
The average for the lower class for those that experienced abuse in their home or homeschooling environment was 73.81%. The average for the middle class for those that experienced abuse in their home or homeschooling environment was 57.49%.The average for the upper class for those that experienced abuse in their home or homeschooling environment was 60.71%.


There was a substantial decrease in abuse (of 16.32%) moving from the lower class to the middle class. That decrease did not continue, however, moving from the middle class to the upper class. Rather, abuse increased (by 3.22%) from the middle class to the upper class. Thus there did not seem to be a direct correlation between wealth and the frequency of abuse in general.
Some specific forms of abuse, however, did seem to correlate with wealth. For example, economic abuse decreased as wealth increased: from the lower class (40.48%) to the middle class (23.95%) to the upper class (17.86%).
Medical abuse also decreased as wealth increased, and in fact was non-existent in the upper class: from the lower class (30.95%) to the middle class (10.78%) to the upper class (0%).
Educational abuse also decreased as wealth increased: from the lower class (40.48%) to the middle class (20.96%) to the upper class (14.29%).
Emotional and verbal abuse were the main categories in which abuse did not consistently decrease as wealth increased. Each decreased from the lower class to the middle class, but then increased from the middle class to the upper class: Emotional abuse went from 66.67% (lower) down to 48.5% (middle) and then up to 53.57%. Verbal abuse went from 59.52% (lower) down to 41.92% (middle) and then up to 42.86% (upper).
Thus while specific forms of abuse did correlate to a decrease or increase in wealth, this fact was not consistent enough to generalize a direct correlation. In fact, several forms of abuse increased in frequency from the middle class to the upper class.
That said, what can be generalized is that abuse was consistently the highest in families in the lower class or below the poverty line.
Economics and Current Religious Beliefs
78.84% of respondents said their homeschool experience involved fundamentalist Christianity.
This number was highest in the lower class, at 88.1%, dropping to 77.77% in the middle class.
This number was then lowest in the upper class, at 71.42%. So while the overwhelming majority of respondents grew up in fundamentalist Christian environments regardless of economic class, those environments were slightly less fundamentalist as wealth increased.


The most interesting trends, as far as a correlation between economics and current religious beliefs are concerned, is the percentage of respondents who grew up in fundamentalist Christian environments and then left Christianity for agnosticism, atheism, or another religion (cited were Paganism and Satanism).
In the upper class, only 24.99% believed their fundamentalist Christian homeschool experience influenced them towards agnosticism, atheism, or another religion. This increased to 35.08% in the middle class.
In the lower class, 45.24% believed their fundamentalist Christian homeschool experience influenced them towards agnosticism, atheism, or another religion.

That is approximately 20% more than those in the upper class (and 10% more than those in the middle class) influenced towards agnosticism, atheism, or another religion.
These findings seem to suggest that, as wealth decreases, fundamentalist Christianity in homeschooling experiences increases — but only slightly so. However, as wealth decreases, the number of respondents — with fundamentalist Christian environments — turning their backs on Christianity significantly increases.
*****
< Part Two: Summary of Findings | Part Four: Parental Education as a Factor >

Please anyone correct me if I’m wrong, as it’s been a decade since I studied statistics.
Statistics come into play because you’re trying to draw conculusions on a population (homeschoolers) from a sample (the survey). I believe that 28 (the number of ‘upper class’ respondents) is lower than the minimum sample size for statistically significant results. This means that while you could (presuming random sampling) draw statistically significant conclusions on what percet of ‘homeschoolers’ were upper class, it can be mathematically demonstrated that your data doesn’t allow you to draw statisticcally significant conclusions on what percentage of ‘upper class’ ‘homeschoolers’ have certain characteristics. Mathematically, the only percentage that can be reported with 95% confidence is “greater than 0% / less than 100% of upper class homeschoolers are ___”.
I checked to see the ‘upper class’ sample size (which turned out to be 28) because as the ‘homeschooled’ child of very wealthy parents, the results did not jive with my experience. For example, I was seriously medically neglected. If your results were statistically significant, I’d be a strange case. However, given the sam[le size of only 28, we don’t have the data to know how frequent my experience was in the general population of homeschoolers (even if the survey were a random sample of homeschoolers). From the data the only guess we can make is that it’s less than 100%.
This is relevant because you also posted my article today. Reading this page one would recieve the impression that my experience was extremely uncommon. However, we don’t have the information to determine whether or not it is common.
LikeLike
These are great observations, Rebecca. Thank you for pointing all that out.
LikeLike
p.s. I put ‘homeschoolers’ in quotation marks only because I think it’s a misnomer to call home education (or lack thereof) a ‘school’.
LikeLike
I really respect your work so I’m sorry to bring this up, but I think it’s important.
Again, not 100% confident (pun intended) that my statistics are accurate, so I welcome critique.
Given the sample sizes, I do not believe this conclusion, and others like it in this post, can be made:
“There was a substantial decrease in abuse (of 16.32%) moving from the lower class to the middle class. ”
I believe that given your sample sizes of lower class and middle class homeschoolers, your confidence intervals are 7.5 and 15, respectively.
So with the following statistics:
“The average for the lower class for those that experienced abuse in their home or homeschooling environment was 73.81%. The average for the middle class for those that experienced abuse in their home or homeschooling environment was 57.49%.”
You can determine with 95% confidence using your data (assuming random sampling, of course) that between 66% and 81% of lower class homeschoolers were abused and between 42% and 72%.
In short, I believe that given your data and a 95% confidence level, it’s just as possible that there is a rise of 6% in abuse from poor to middle class, as that there is the quoted 16% decrease.
LikeLike
I liked the pun. 🙂
These observations are absolutely welcome. Please do not hesitate to make any others you feel are important.
LikeLike
what’s crazy is that sex education ranks at the bottom for all three. That tells you something! (and I was one of those who got no sex education.)
LikeLike
It may be listed somewhere, but I missed how you defined the lower, middle and upper classes. Can you please point me to those distinctions? Thanks.
LikeLike
nice charts
LikeLike